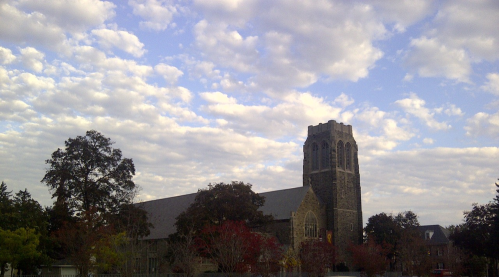
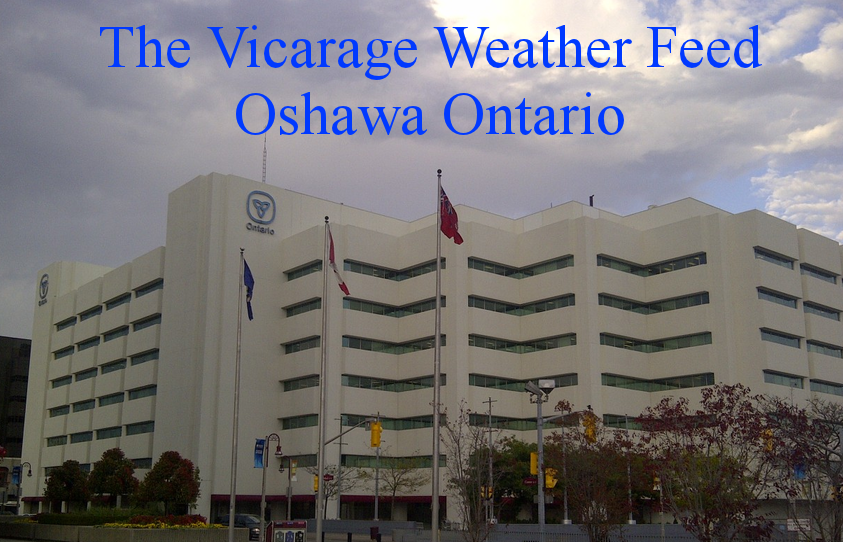


| North Facing Camera Click On Play Button To View Live Image |
Sky Facing Camera Click On Image To View Full Screen In New Window 
|


Space Weather Observations, Alerts, and Forecast
Current Space Weather Overview

|
3-day Solar-Geophysical Forecast
Product: 3-Day Forecast
- Issued: 2024 Apr 27 0030 UTC
Prepared by the U.S. Dept. of Commerce, NOAA, Space Weather Prediction Center.
Geomagnetic Activity Observation and Forecast
The greatest observed 3 hr Kp over the past 24 hours was 5 (NOAA Scale G1). The greatest expected 3 hr Kp for Apr 27-Apr 29 2024 is 4.00 (below NOAA Scale levels).
| Apr 27 | Apr 28 | Apr 29 | |
|---|---|---|---|
| 00-03UT | 3.67 | 3.67 | 2.67 |
| 03-06UT | 3.00 | 3.33 | 2.00 |
| 06-09UT | 3.00 | 3.33 | 2.33 |
| 09-12UT | 4.00 | 3.00 | 2.67 |
| 12-15UT | 3.00 | 3.00 | 2.33 |
| 15-18UT | 3.00 | 3.33 | 2.33 |
| 18-21UT | 3.00 | 2.00 | 2.33 |
| 21-00UT | 3.67 | 2.00 | 2.33 |
Rationale: No G1 (Minor) or greater geomagnetic storms are expected.
Solar Radiation Activity Observation and Forecast
Solar radiation, as observed by NOAA GOES-18 over the past 24 hours, was below S-scale storm level thresholds.
| Apr 27 | Apr 28 | Apr 29 | |
|---|---|---|---|
| S1 or greater | 15% | 5% | 1% |
Rationale: There is a slight chance for S1 (Minor) storms on 27 Apr due to the location and flare potential of multiple active regions.
Radio Blackout Activity and Forecast
No radio blackouts were observed over the past 24 hours.
| Apr 27 | Apr 28 | Apr 29 | |
|---|---|---|---|
| R1-R2 | 75% | 55% | 35% |
| R3 or greater | 15% | 5% | 5% |
Rationale: R1-R2 (Minor-Moderate) radio blackouts are expected, with a slight chance for an R3 (Strong) event, on 27 Apr. R1-R2 events are likely on 28 Apr and there is a chance for R1-R2 events on 29 Apr.
Real Time Images of the Sun
SOHO EIT 171
|
SOHO EIT 195
|
SOHO EIT 284
|
SOHO EIT 304
|
SDO/HMI Continuum
|
SDO/HMI Magnetogram
|
LASCO C2
|
LASCO C3
|
The sun is constantly monitored for sun spots and coronal mass ejections. EIT (Extreme ultraviolet Imaging Telescope) images the solar atmosphere at several wavelengths, and therefore, shows solar material at different temperatures. In the images taken at 304 Angstrom the bright material is at 60,000 to 80,000 degrees Kelvin. In those taken at 171 Angstrom, at 1 million degrees. 195 Angstrom images correspond to about 1.5 million Kelvin, 284 Angstrom to 2 million degrees. The hotter the temperature, the higher you look in the solar atmosphere.
NASA Solar Dynamic Observatory
Solar Wind
Real-Time Solar Wind
Real-Time Solar Wind data broadcast from NASA's ACE satellite. |
|
WSA-Enlil Solar Wind Prediction |
| Move your cursor over the timeline to 'scrub' through the forecast. |
WSA-Enlil is a large-scale, physics-based prediction model of the heliosphere, used by the Space Weather Forecast Office to provide 1-4 day advance warning of solar wind structures and Earth-directed coronal mass ejections (CMEs) that cause geomagnetic storms. Solar disturbances have long been known to disrupt communications, wreak havoc with geomagnetic systems, and to pose dangers for satellite operations.
Solar Cycle
Sun Spot Number Progression
|
The Solar Cycle is observed by counting the frequency and placement of sunspots visible on the Sun. The forecast comes from the Solar Cycle Prediction Panel representing NOAA, NASA and the International Space Environmental Services (ISES). The Prediction Panel has predicted Cycle 25 to reach a maximum of 115 occurring in July, 2025.
Auroral Activity Forecast
Northern Hemi Auroral Map
|
Southern Hemi Auroral Map
|
Instruments on board the NOAA Polar-orbiting Operational Environmental Satellite (POES) continually monitor the power flux carried by the protons and electrons that produce aurora in the atmosphere. SWPC has developed a technique that uses the power flux observations obtained during a single pass of the satellite over a polar region (which takes about 25 minutes) to estimate the total power deposited in an entire polar region by these auroral particles. The power input estimate is converted to an auroral activity index that ranges from 1 to 10.
Radio Communications Impact
D-Region Absorption
D-Region Absorption Prediction
|
The D-Region Absorption Product addresses the operational impact of the solar X-ray flux and SEP events on HF radio communication. Long-range communications using high frequency (HF) radio waves (3 - 30 MHz) depend on reflection of the signals in the ionosphere. Radio waves are typically reflected near the peak of the F2 layer (~300 km altitude), but along the path to the F2 peak and back the radio wave signal suffers attenuation due to absorption by the intervening ionosphere. The D-Region Absorption Prediction model is used as guidance to understand the HF radio degradation and blackouts this can cause.
VHF and HF Band Conditions
|
|
|
|
Credits:
Space Weather Images and Information (excluded from copyright) courtesy of:NOAA / NWS Space Weather Prediction Center
Mauna Loa Solar Observatory (HAO/NCAR)
SOHO (ESA & NASA).
Space Weather links:
3-Day Forecast of Solar and Geophysical Activity
Space Weather Overview
LASCO Coronagraph
Real-Time Solar Wind
Space Weather Advisory Outlooks
Space Weather Forecast Disussions
Space Weather Alerts, Watches and Warnings
Solar and Heliospheric Observatory (SOHO)
The Very Latest SOHO Images
Powered by Space Weather PHP script by Mike Challis
Additions by:
Martin of Hebrides Weather
Grant Miles of CamWX
Ken True of Saratoga Weather
with 3-day Solar-Geophysical Forecast text formatting by Jeremy Dyde of Jerbils Weather
![[WOW]](WOW.gif)
![[Skywarn]](Skywarn.gif)

![[AWEKAS]](AWEKAS.gif)
![[CANWARN]](canwarn.png)
![[Weather Underground PWS IONOSHAW2]](https://dw7240.com/Base-Canada/wunderground.png)

![[WA]](WA.gif)
![[DAVIS]](DAVIS.gif)
![[anything]](ANYTHING.gif)
![[CoCoRaHS]](cocorahs_can.jpg)
![[MADIS]](MADIS.gif)
![[wcloud]](weathercloud.gif)
![[NOAARADIO]](ani-noaa-radio-small.gif)
![[NOAA]](NOAA.gif)
![[wxtogether]](weather_together.jpg)
![[ipcamlive]](IPCamLive.png)
![[ThingSpeak]](thingspeak.png)

![[MESOWEST]](MESOWEST.gif)
![[PWS]](PWS.gif)
![[COWN]](COWN.gif)
![[CWOP]](CWOP.gif)
![[WEATHERBUG]](WEATHERBUG.png)
![[WINDFINDER]](windfinder.gif)
