| North Facing Camera Click On Play Button To View Live Image |
Cam Image with Weather Conditions Overlay Click On Image To View Full Screen In New Window 
|

14°C
Oshawa, Ontario, Canada
Language: en


Language: en
Updated:
17/04/2026 12:05

Navigation
- Home
- SMART HOME Weather Station Template

- Live Data
- Radar
- Earth's Pressure Systems
- Forecast and Advisories
- Lightning Maps
- Worldwide Forecasts
- EC Wx Data
- NWS Weather Predictions, forecasts and Advisories
- NWS Forecast Maps
- NWS Weather Prediction Center Data (W.P.C.)
- NWS Analysis, Advisories and Forecasts (N.W.C. / M.D.L.)
- NWS Forecast Charts and Probability Maps
- NWS Forecast Maps
- NWS Forecast Maps (All)
- NWS Clickable National Advisory Maps - Various Sizes
- NWS Roundups By Site
- NWS N.O.H.R.S.C. Snow Analysis
- NWS US 3 Day Excess Rain Forecasts
- NWS Probability Maps
- NWS Lightning Probability Maps
- NWS Alaska Sea Ice Map
- NWS SnowFall Probability Forecast
- NWS Snow and Ice Accumulation Potential
- NWS Winter Storm Severity Index by WFO
- NWC Snow Analyses For The Present Season
- NWS C.P.C. Near Term Outlook
- NWS C.P.C. Long Term Outlook
- NWS C.P.C. Outlook and Drought Monitor
- NWS C.P.C. Wind Chill Outlook
- NWS Heat Index Chart
- NOAA Maps and Images
- Air Quality, Flu, Light Polution and Pollen details
- Almanac
- Station History Reports
- Temperature Reports
- Rain Reports
- Wind Reports
- Wind Run Reports
- Wind Direction Reports
- Snow Reports
- Snow Depth Detail Reports
- Barometer Reports
- Degree Days Reports
- Sunshine Hours Reports
- Maximum Solar Energy Reports
- Solar Kilowatt Hours Reports
- Maximum Daily UV Index Reports
- Average Dew Point Reports
- Average Wet Bulb Reports
- Evapotranspiration Reports
- Humidity Reports
- NOAA reports
- Freeze Data
- Nearby METAR Reports
- Station History Reports
- Station Graphs

- High, Low, Average Data
- Historical Data
- Weather Trends
- Past Weather History
- CWOP Data Quality Stats
- CWOP Spread Distribution Stats
- Station Trace Charts and Weather Extremes
- Astronomy
- Sun / Moon / Seasons
- Space Weather
- Mars InSight Mission
- NASA Moon Phases Video for 2013
- NASA Moon Phases Video for 2014
- NASA Moon Phases Video for 2015
- NASA Moon Phases Video for 2016
- NASA Moon Phases Video for 2017
- NASA Moon Phases Video for 2018
- NASA Moon Phases Video for 2019
- NASA Moon Phases Video for 2020
- NASA Moon Phases Video for 2021
- NASA Moon Phases Video for 2022
- NASA Moon Phases Video for 2023
- NASA Moon Phases Video for 2024
- NASA Moon Phases Video for 2025
- NASA Moon Phases Video for 2026
- Star Chart
- Sun / Moon / Seasons
- Catastrophic Weather / Events
- Road Conditions Map
- Marine Traffic Map
- Aircraft Flight Map
- River Heights Map
- NOAA Wx Radio
- Mesomaps
- Station Info
- Weather Varibles Conversion
- Weather Videos
- Weather Conditions Report Outloud

- Emergency Weather Preperation
- Links
- Website Banners
- About
- Contact
- Website Map
Weather Alerts
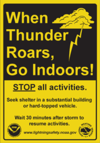
Lightning Safety
Fire Index

AQI Index

EC WxRadio Audio Feed
Environment Canada
|
Toronto, Ont. |
Cloud Base
Sunlight Hours
13 hrs 30 min 22 sec
Sunlight Yesterday
13 hrs 33 min 15 sec
of Sunlight Today
Mouse Over Image
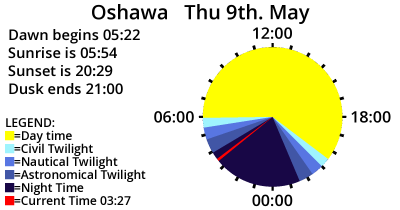
To Show Legend
Todays Sunlight is:
2 min 53 sec Longer
Than Yesterday
13 hrs 36 min 6 sec
Sunlight Tomorrow
Sunlight Yesterday
13 hrs 33 min 15 sec
of Sunlight Today
Mouse Over Image
To Show Legend
Todays Sunlight is:
2 min 53 sec Longer
Than Yesterday
13 hrs 36 min 6 sec
Sunlight Tomorrow
Wind Finder
Wind Alert
External Links
Environment Canada

WD Forum

WX Forum

WX Spots

Social Media
Twitter

Facebook

Style Options
News
QR Codes
dw7240.com


Facebook
Twitter

Help keep the website running. Thank You !
