Lake
Good Morning!...

7°C
Oshawa, Ontario, Canada
Lingua: it English Afrikaans български език Català Dansk Nederlands Suomi Français Deutsch Ελληνικά עִבְרִית Magyar Italiano Norsk Polski Português limba română Español Svenska
Dati ricevuti:  17/10/2025 10:20 
  Coperto - Pioggia leggera Temperatura: 7.1°C   Umidità: 91%Aumento 8.0% rispetto ad un ora fa. P.to Rugiada: 5.7°CAumento 1.8°C rispetto ad un ora fa. Vento: N  3.7 km/h Raffica: 3.7 km/h Barometro: 1019.1 mbDiminuzione 0.2  mb/hr  Stabile Pioggia odierna: 0.0 mm UV Index: 0.0  - - -
North Facing Camera

Click On Play Button To View Live Image


Cam Image with Weather Overlay

Click On Image To View Full Screen In New Window


Cam with Overlay Image


Nav Menu

  • Home
  • SMART HOME Weather Station Template
  • Live Data
    • Live Console
    • Live Gauges
    • FreshWDL Graphics
    • ThingSpeak Live Graphs
  • Radar
    • EC Local Radar
    • EC and US National Radar
    • Leaflet Radar
      • Leaflet National Radar
      • Leaflet National Radar - Full Screen
    • NOAA National Radar GRLevel3
      • GRLevel3 Radar
      • GRLevel3 Radar Full Screen
    • NWS Radar
      • US and Territories Current NOAA Ridge Radar
  • Earth's Pressure Systems
    • All Conditions Map
    • Wind+ Map
  • Forecast and Advisories
    • EC 6 Day Local Forecast
    • WU 5 Day Forecast
    • AW 7 Day Forecast
    • OWM 7 Day Forecast
    • PW 7 Day Forecast
    • VC 14 Day Forecast
    • E.C. Advisories
      • Marine Advisory
    • US Drought Forecast
    • UV Index
      • UV Index Forecast
      • UV Index Information
    • Buoy Forecasts
      • Buoy Forecast Canada
      • Buoy Forecast United Kingdom
  • Lightning Maps
    • Accuweather / TOA Map
  • Worldwide Forecasts
    • Canadawide Mountain Forecast
  • EC Wx Data
    • EC Satellite Images
      • EC Current IR Image
      • EC Current Visible and IR Image
    • EC Weather At A Glance
    • EC Fire Weather
  • NWS Weather Predictions, forecasts and Advisories
    • NWS Forecast Maps
      • NWS Local Storm Report
    • NWS Weather Prediction Center Data (W.P.C.)
      • NWS W.P.C. Nat. Digital Forecast Database
      • NWS W.P.C. US 3 Day Front Forecast Charts
      • NWS W.P.C. US 3-7 Day Forecast Charts
      • NWS W.P.C. Day 1-3 Surface Low Tracks
      • NWS W.P.C. QFPF 6 Hr Loops
      • NWS W.P.C. QFPF 24-72 Hr Loops
      • NWS W.P.C. US River Flood Outlook
    • NWS Analysis, Advisories and Forecasts (N.W.C. / M.D.L.)
      • NWS Surface Analysis 6h Loop
      • NWS Surface Analysis 24h Loop
      • NWS M.D.L. US 12h Thunderstorm Forecast Chart
    • NWS Forecast Charts and Probability Maps
      • NWS Forecast Maps
      • NWS Forecast Maps (All)
      • NWS Clickable National Advisory Maps - Various Sizes
      • NWS Roundups By Site
      • NWS N.O.H.R.S.C. Snow Analysis
      • NWS US 3 Day Excess Rain Forecasts
      • NWS Probability Maps
        • NWS Lightning Probability Maps
        • NWS Alaska Sea Ice Map
        • NWS SnowFall Probability Forecast
        • NWS Snow and Ice Accumulation Potential
        • NWS Winter Storm Severity Index by WFO
        • NWC Snow Analyses For The Present Season
        • NWS C.P.C. Near Term Outlook
        • NWS C.P.C. Long Term Outlook
        • NWS C.P.C. Outlook and Drought Monitor
        • NWS C.P.C. Wind Chill Outlook
        • NWS Heat Index Chart
  • NOAA Maps and Images
    • NOAA Prognosis and Surface Maps
      • NOAA W.P.C. Prognosis Map Map
      • NOAA Atlantic Surface Analysis Map
      • NOAA Pacific Surface Analysis Map
    • NOAA Storm Prediction Center Data (S.P.C.)
      • NOAA S.P.C. Reports and Warnings
      • NOAA S.P.C. Maps and Forecast Discussion
      • NOAA S.P.C. Severe Weather Prob Data
      • NOAA S.P.C. Historical Summary
      • NOAA S.P.C. Watch Summary
    • Combined GOES E and W Color Loops
      • NOAA Composite US 4 Hour Loop
      • NOAA Composite US BIG 12 Hour Loop
    • NOAA Satellite Images
      • NOAA GOES16 GIF Loops
      • NOAA GOES18 GIF Loops
      • NOAA GOES19 GIF Loops
      • NOAA GOES16 Satellite Loops
      • NOAA GOES18 Satellite Loops
      • NOAA GOES19 Satellite Loops
      • NOAA SSEC Global Basin Loops
    • NOAA GOES East Wind Shear Image
  • Air Quality, Flu, Light Polution and Pollen details
    • Flu Maps
      • Present Flu Data
      • Past Flu Data
    • Light Polution Map
  • Almanacco
    • Station History Reports
      • Temperature Reports
      • Rain Reports
      • Wind Reports
      • Wind Run Reports
      • Wind Direction Reports
      • Snow Reports
      • Snow Depth Detail Reports
      • Barometer Reports
      • Degree Days Reports
      • Sunshine Hours Reports
      • Maximum Solar Energy Reports
      • Solar Kilowatt Hours Reports
      • Maximum Daily UV Index Reports
      • Average Dew Point Reports
      • Average Wet Bulb Reports
      • Evapotranspiration Reports
      • Humidity Reports
    • NOAA reports
    • Freeze Data
    • NOAA records
    • Report METAR
  • Grafici
    • Weather Display Graphs
  • High, Low, Average Data
  • Historical Data
    • Statistiche
    • Past Weather History
    • CWOP Data Quality
      • CWOP Data Quality Stats
      • CWOP Spread Distribution Stats
    • Station Trace Charts, SQL Database and Weather Extremes
      • 2015 Rainfall / Snowfall / Trace Charts
        • Rainfall Chart
        • Snowfall Chart
        • Trace Chart
        • Total Rain Days
      • 2016 Rainfall / Snowfall / Trace Charts
        • Rainfall Chart
        • Snowfall Chart
        • Trace Chart
        • Total Rain Days
      • 2017 Rainfall / Snowfall / Trace Charts
        • Rainfall Chart
        • Snowfall Chart
        • Trace Chart
        • Total Rain Days
      • 2018 Rainfall / Snowfall / Trace Charts
        • Rainfall Chart
        • Snowfall Chart
        • Trace Chart
        • Total Rain Days
      • 2019 Rainfall / Snowfall / Trace Charts
        • Rainfall Chart
        • Snowfall Chart
        • Trace Chart
        • Total Rain Days
      • 2020 Rainfall / Snowfall / Trace Charts
        • Rainfall Chart
        • Snowfall Chart
        • Trace Chart
        • Total Rain Days
      • WU Historical Data
      • Weather Extremes
        • Worldwide Extremes
        • USA Extremes
  • Effemeridi
    • Sun / Moon / Seasons
      • Space Weather
      • Mars InSight Mission
      • NASA Moon Phases Video for 2013
      • NASA Moon Phases Video for 2014
      • NASA Moon Phases Video for 2015
      • NASA Moon Phases Video for 2016
      • NASA Moon Phases Video for 2017
      • NASA Moon Phases Video for 2018
      • NASA Moon Phases Video for 2019
      • NASA Moon Phases Video for 2020
      • NASA Moon Phases Video for 2021
      • NASA Moon Phases Video for 2022
      • NASA Moon Phases Video for 2023
      • NASA Moon Phases Video for 2024
      • NASA Moon Phases Video for 2025
    • Star Chart
  • Catastrophic Weather / Events
    • Power Outages Map
    • Fire Weather Index
    • Worldwide Emergency and Disaster Map
    • Hurricane, Tornado and Earthquake Reports and Images
      • National Hurricane Center
        • Atlantic Region
        • Pacific Region
      • Earthquake Info
        • Earthquake activity in Canada
        • Earthquake activity in USA
        • Earthquake activity in UK
  • Road Conditions Map
  • Marine Traffic Map
  • Aircraft Flight Map
  • River Heights Map
  • NOAA Wx Radio
    • NOAA/EC All Hazards Radio Live Stream
    • NOAA Wx Radio Streams
    • NOAA Weather Radio Outages
  • Mesomaps
    • Global Networks
    • Ontario Weather Network
    • CoCoRaHS Mesomap
    • NOAA Weather Radio Mesomap
  • Station Info
    • Station Status
    • Version Control
    • Mesomap Version Control
    • Check Fetch Times
  • Weather Varibles Conversion
  • Weather Videos
    • Lightning Video
    • Winter Forecast 2017 - 2018
    • Winter Forecast 2018 - 2019
    • Winter Forecast 2019 - 2020
    • Winter Forecast 2020 - 2021
    • Winter Forecast 2021 - 2022
    • Winter Forecast 2022 - 2023
    • Winter Forecast 2023 - 2024
    • Winter Forecast 2024 - 2025
  • Weather Conditions Report Outloud
  • Emergency Weather Preperation
  • Links
  • Website Banners
  • Informazioni
  • Contact
  • Mappa del Sito

Weather Alerts


Lightning Safety

     lightningsafety     

Fire Index

     fireboard     

AQI Index

     aqiindex     

EC WxRadio Audio Feed

         
  Environment Canada speaker
              
From XMJ225
Toronto, Ont.


Cloud Base

    
Cloud Base     

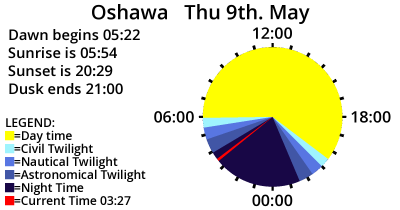
Sunlight Hours

10 hrs 58 min 15 sec
Sunlight Yesterday
10 hrs 55 min 21 sec
of Sunlight Today

Mouse Over Image


sun
popup


To Show Legend

Todays Sunlight is:
2 min 54 sec Shorter
Than Yesterday
10 hrs 52 min 26 sec
Sunlight Tomorrow
    

Wind Finder


windfinder
    

Wind Alert


Links Esterni

    
  Environment Canada ec

  WD Forum wdforum

    
  WX Forum wxforum

  WX Spots wxspots

Social Media


  Twitter Go To Twitter for The Vicarage Weather Feed

  Facebook Go To Facebook for The Vicarage Weather Feed

Layout


Widescreen:
|

News

QR Codes


  dw7240.com QRCODE


  Facebook QRFCODE


  Twitter QRTCODE


  Help keep the website running. Thank You ! QRTCODE